Description
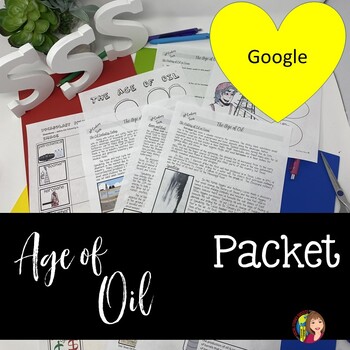
Engage your students with activities and content readings on the Age of Oil – all offered as an independent work packet or on-line with Google Slides.
In this resource, students will learn about the Age of Oil with content area readings, answer questions, summarize their notes in Cartoon Notes, and create a sensory figure.
You will receive:
– A vocabulary activity (Note: the Google version includes copying and pasting pictures, the other versions include typing definitions in form fields or writing).
– 3 pages of content readings on the history of the oil industry, including Spindletop, and the current oil industry in Texas,
–Cartoon Notes on the Age of Oil, and
-A Sensory Figure – for students to share what they have learned.
⭐Please download the preview for a sample of the activity. ⭐
2019 US History TEKS for 7th Grade
(7) History. The student understands how individuals, events, and issues shaped the history of Texas during the late 19th, 20th, and early 21st centuries. The student is expected to:
(A) explain how the oil industry led to the industrialization of Texas;
(B) define and trace the impact of “boom-and-bust” cycles of leading Texas industries throughout the 20th and early 21st centuries such as farming, oil and gas production, cotton, ranching, real estate, banking, and computer technology;
(20) Social studies skills. The student applies critical-thinking skills to organize and use information acquired through established research methodologies from a variety of valid sources, including technology. The student is expected to:
(B) analyze information by applying absolute and relative chronology through sequencing, categorizing, identifying cause-and-effect relationships, comparing, contrasting, finding the main idea, summarizing, making generalizations and predictions, and drawing inferences and conclusions;
(C) organize and interpret information from outlines, reports, databases, and visuals, including graphs, charts, timelines, and maps;
(E) support a point of view on a social studies issue or event;
(G) create a visual representation of historical information such as thematic maps, graphs, and charts representing various aspects of the United States; and
Please review all product descriptions and previews. If you have a question, contact me before you purchase at SocialStudiesSuccess1@gmail.com. As this is a digital product, all sales are final.
❤️ Dawn


Reviews
There are no reviews yet.