Graphic Organizers are one of the key components of sound Social Studies instruction – but why? And how do you choose the right one to get the job done? For me, a great graphic organizer is what ties the lesson together – it is evidence of instruction and of thinking. The choices for graphic organizers are endless, but if you really want a tight lesson, you need to make a choice for your graphic organizer.
For example, let’s say you are teaching a lesson on the causes of the Civil War. What type of graphic organizer would you use for this complex topic? Are you teaching the difference between the economies of the North and South? Then try one of these types of Venn diagram:

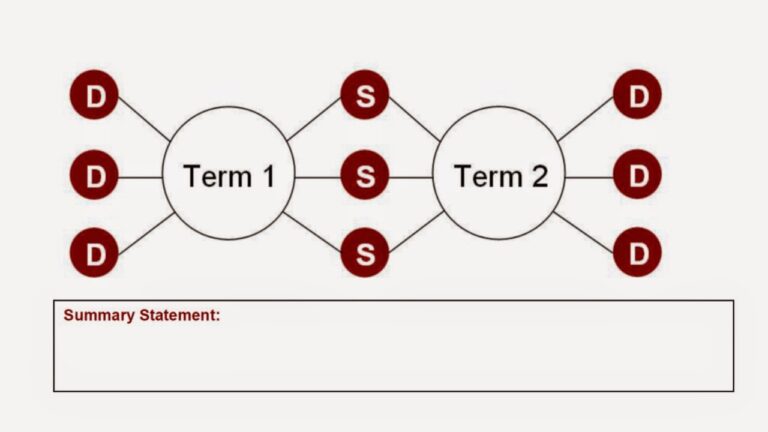
This is called a Double Bubble (my 7th graders loved saying it!) and it is the perfect graphic organizer for comparing two different types of information. You could post the differences outside the bubble, and the similarities on the inside. The summary statement can be used at the end to assess your students understanding of the two concepts.
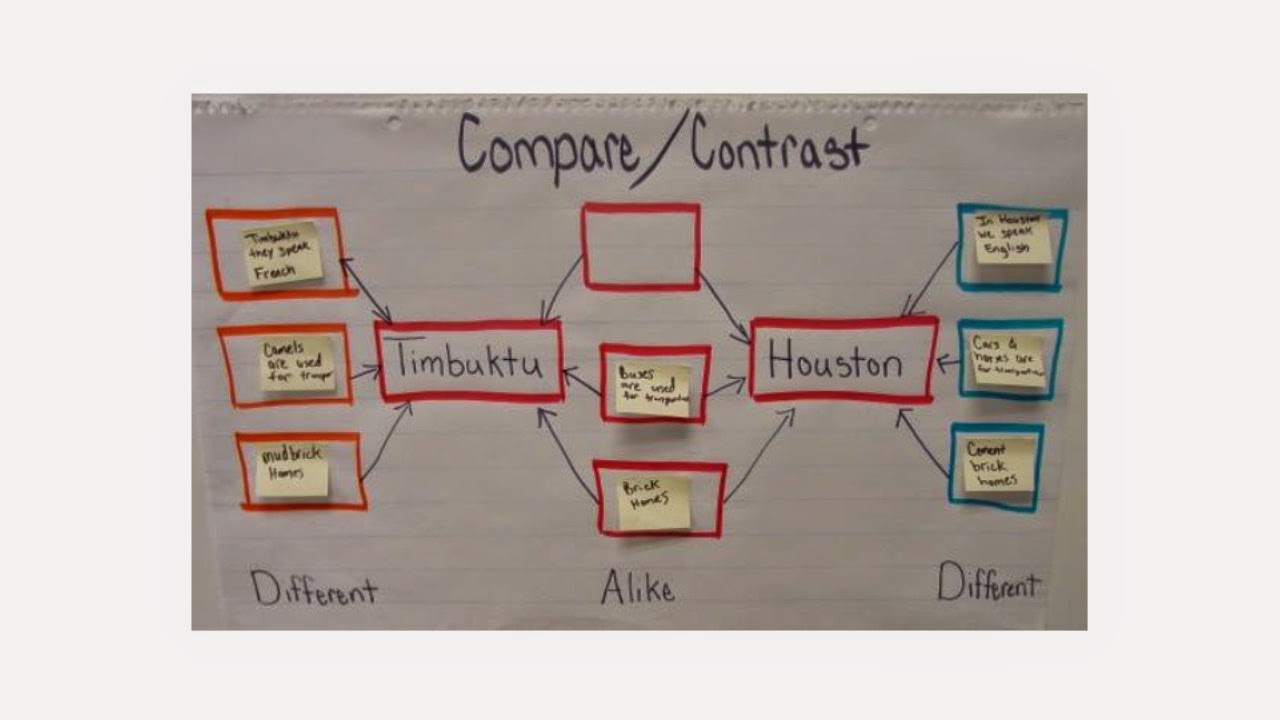
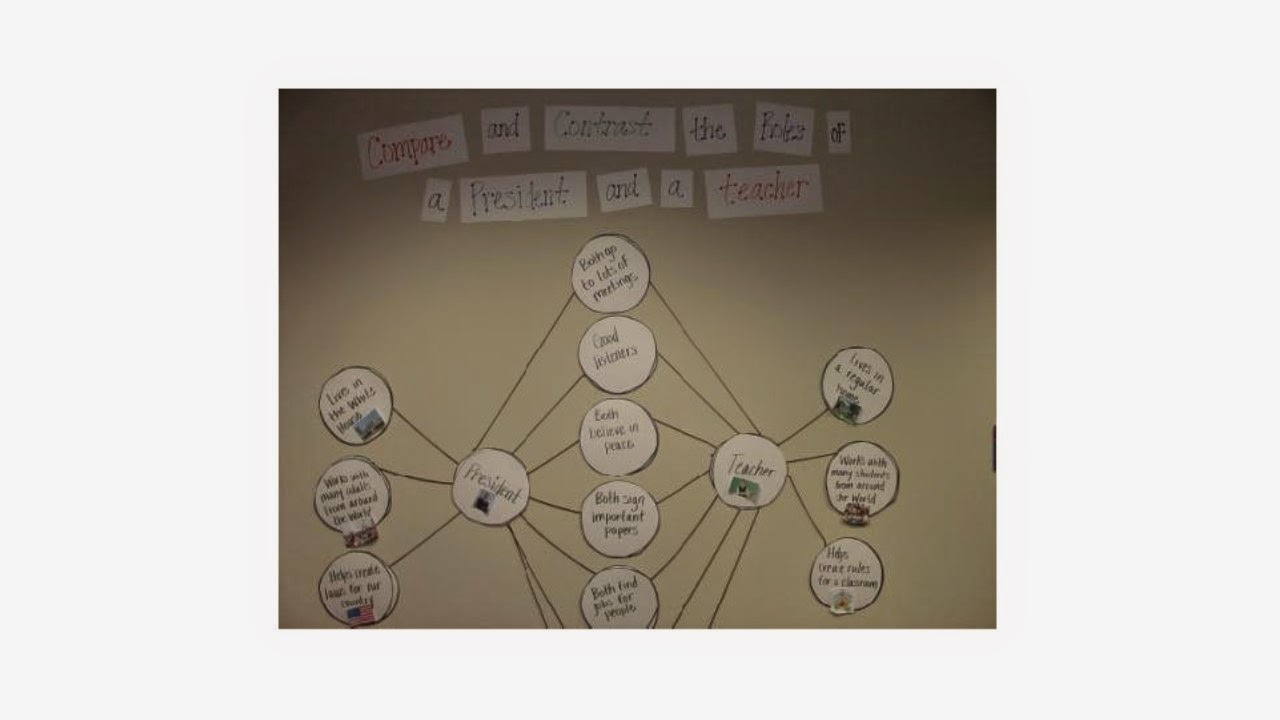
Here are two different concrete examples of a Double Bubble:
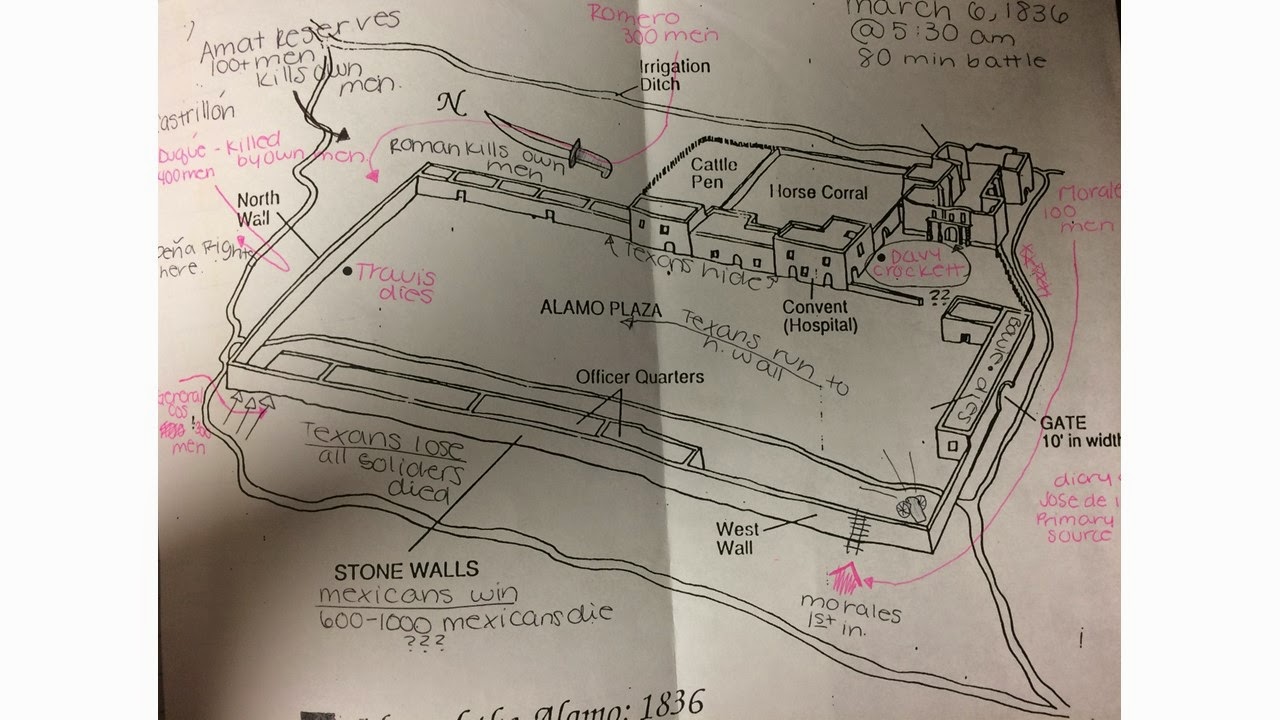
My favorite types of graphic organizers are those that can be used to also tell a story along with the content. These are usually some type of annotated images. Students can annotate almost any image to share the story behind the content in addition to summarizing the key facts. These can be made by scanning an image, painting or even a map. The story of the Battle of the Alamo is one of my favorites, so here is the graphic organizer I used for it: